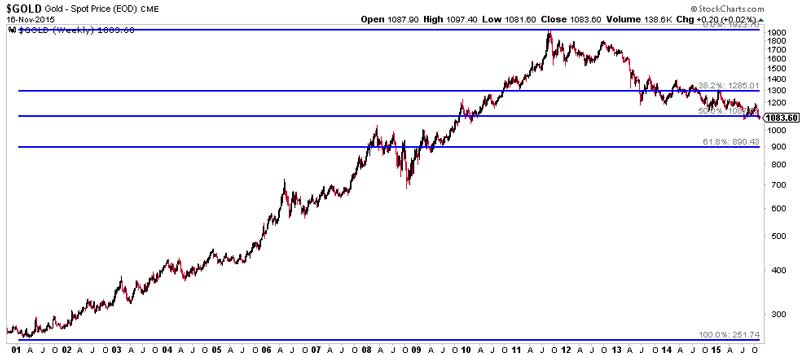
Nobody talks about the meaning of the $1087 /oz gold price, but it is a critical price level. The next big moves in gold is being determined at today’s price level. The gold market is testing the significance of $1086.17 /oz. It marks the 50% retracement gold’s secular rally that started in 2001. Gold’s short and mid term outlook will be determined by the behavior of price at the $1087 /oz price level.
We believe the decline in gold is exaggerated, both from a fundamental perspective (the interest rate saga is clearly overhyped, and central banks have not engaged into any action as they are ‘guiding the markets forward’ to an interest rate hike since 2010) and a technical perspective (miners lost 85% of their value since their peak).
Be that as it may, chances are high that a structural bottom is being set, as we speak. Look at the red rectangle on the chart, it shows at least 5 clearly distinguishable tests around the 13.50 points level of the GDX mining index.
If that bottom holds, the short term bounce should take the GDX index to at the 17.50 level, a 30% upside move, where it should find structural resistance. Obviously, the strength of the rally is directly correlated with the behavior of the price of gold itself.
The next wave in gold and miners will be determined by the behavior around 1087 USD/oz gold and 13.50 in the GDX. Do not forget to consider the bearish scenario: once gold breaks below 1087 USD/oz, and closes 3 days below that price level, it is setting up for structural breakdown.


